HDB Financial Services Limited Unlisted Shares
Industry: Financial | Sector: Banking | Depository: NSDL, CDSL
₹ 5,130.00
Key Indicators
| Key Indicators | 2024 |
|---|---|
| Current Share Price | 5,130.00 |
| Face Value | Share | 10.00 |
| Book Value | Share | 144.50 |
| Price To Earning (PE) | 35.50 |
| Price | Sales | 6.20 |
| Price | Book | 7.60 |
| Outstanding Shares (Crores) | 79.07 |
| Market Cap (Rs. Crores) | 87,437.07 |
| Debt | Equity | 5.70 |
| Dividend | Share | 1.00 |
| Dividend % (On Current Market Price) | 0.1% |
| Return on Total Assets | 5.3% |
| Return on Equity | 35.5% |
| Return on Working Capital | 9.1% |
* Ratio is calculated based on latest financial & current share price.
About The Company
HDB Financial Services (HDBFS) is a leading Non-Banking Financial Company (NBFC) that caters to the growing needs of an aspirational India, serving both Retail & Commercial Clients. It is a Systemically Important Non-Deposit taking Non-Banking Financial Company (‘NBFC’) Incorporated in 2008, they are a well-established business with strong capitalization. HDBFS is accredited with CARE AAA & CRISIL AAA ratings for its long-term debt & Bank facilities and an A1+ rating for its short-term debt & commercial papers, making it a strong and reliable financial institution.
Pricing Trend
Financial Summary
Revenue Growth %
EBITDA Margin %
NET Margin %
Profit & Loss Summary
(All Amount in ₹ Crores)
| PROFIT & LOSS | 2024 | 2023 | 2022 | 2021 | 2020 | 2019 | 2018 |
|---|---|---|---|---|---|---|---|
| Revenue | 14,171.1 | 12,402.9 | 11,306.3 | 10,944.8 | 10,756.5 | 8,724.8 | 7,027.1 |
| Expense | 5,857.0 | 6,151.7 | 6,534.3 | 6,453.4 | 5,100.9 | 3,605.5 | 3,096.6 |
| EBITDA | 8,314.1 | 6,251.2 | 4,772.0 | 4,491.4 | 5,655.6 | 5,119.3 | 3,930.5 |
| Other Cost | 5,009.4 | 3,623.8 | 3,424.4 | 3,990.7 | 4,191.1 | 3,395.3 | 2,494.4 |
| Profit Before Taxes | 3,304.7 | 2,627.4 | 1,347.6 | 500.7 | 1,464.5 | 1,724.1 | 1,436.1 |
| Tax Expense | 843.9 | 668.1 | 336.2 | 109.2 | 459.6 | 570.8 | 503.1 |
| Profit after Taxes | 2,460.8 | 1,959.4 | 1,011.4 | 391.5 | 1,004.9 | 1,153.2 | 933.0 |
| Other Income | Exp. | 2,424.4 | 10.6 | 13.7 | -13.5 | -55.0 | -3.4 | -3.6 |
| Income (Net Of Taxes) | 4,885.2 | 1,969.9 | 1,025.1 | 378.0 | 949.8 | 1,149.8 | 929.4 |
| Outstanding Share | 79.1 | 79.1 | 78.8 | 78.8 | 78.6 | 78.4 | 78.3 |
| Earning per Share (Rs | Share) | 31.1 | 24.8 | 12.8 | 5.0 | 12.8 | 14.7 | 11.9 |
| Revenue Growth % | - | -12.5% | -8.8% | -3.2% | -1.7% | -18.9% | -19.5% |
| EBITDA Margin % | 58.7% | 50.4% | 42.2% | 41% | 52.6% | 58.7% | 55.9% |
| Net Margin % | 34.5% | 15.9% | 9.1% | 3.5% | 8.8% | 13.2% | 13.2% |
| Earning per Share Growth % | - | -20.3% | -48.4% | -60.9% | 156% | 14.8% | -19% |
Balance Sheet
(All Amount in ₹ Crores)
| Balance Sheet | 2024 | 2023 | 2022 | 2021 | 2020 | 2019 | 2018 |
|---|---|---|---|---|---|---|---|
| Cash & Cash Equivalent | 647.9 | 396.0 | 684.0 | 976.4 | 563.2 | 488.5 | 137.4 |
| Non Current Asset | 1,586.4 | 69,130.0 | 60,753.1 | 61,298.1 | 59,770.7 | 54,994.3 | 44,415.1 |
| Current Asset | 90,322.2 | 524.3 | 588.8 | 366.5 | 380.6 | 224.2 | 181.3 |
| Total Asset | 92,556.5 | 70,050.0 | 62,025.9 | 62,641.1 | 60,714.5 | 55,707.0 | 44,733.7 |
| Equity Share Capital | 793.1 | 791.0 | 790.4 | 789.2 | 787.6 | 785.7 | 782.9 |
| Reserves | 12,949.6 | 10,646.0 | 8,749.3 | 7,657.0 | 7,230.2 | 6,392.8 | 5,257.4 |
| Total Equity | 13,742.7 | 11,437.0 | 9,539.7 | 8,446.2 | 8,017.8 | 7,178.5 | 6,040.3 |
| Non Current Liability | 1,014.1 | 57,935.0 | 51,928.7 | 53,580.7 | 52,208.5 | 48,123.8 | 38,312.0 |
| Current Liability | 77,799.7 | 678.3 | 557.5 | 614.2 | 488.2 | 404.7 | 381.4 |
| Total Liabilities | 78,813.8 | 58,613.3 | 52,486.2 | 54,194.8 | 52,696.7 | 48,528.5 | 38,693.4 |
| Total Equity & Liability | 92,556.5 | 70,050.0 | 62,025.9 | 62,641.1 | 60,714.5 | 55,707.0 | 44,733.7 |
Cash Flow Summary
(All Amount in ₹ Crores)
| CASH FLOW SUMMARY | 2024 | 2023 | 2022 | 2021 | 2020 | 2019 | 2018 |
|---|---|---|---|---|---|---|---|
| Operating Activity | -16,736.0 | -6,850.6 | 1,957.1 | -403.5 | -3,013.9 | -8,980.9 | -8,185.6 |
| Investing Activity | -2,145.6 | 973.3 | -703.3 | 131.4 | -1,203.9 | 180.6 | 49.2 |
| Financing Activity | 19,133.6 | 5,796.0 | -1,500.0 | 669.7 | 4,257.0 | 9,444.6 | 8,226.3 |
| Net Cash Flow | 252.0 | -81.3 | -246.2 | 397.6 | 21.2 | 634.4 | 90.0 |
Share Holding
Registered Address
ISIN: INE756I01012
PAN: AABCH8761M
Hdb Financial Services Ltd Radhika, 2nd Floor Law Garden Road Navrangpura, Ahmedabad, Gujarat-380009 IN
Management
Mr. Arijit Basu
chairman
Mr. G Ramesh
managing director & ceo
Mr. Jaykumar Shah
chief financial officer
Ms. Dipti Khandelwal
company secretary
Download Financial Result
News
HDB Financial's MD & CEO explains discounted valuation for the IPO
HDB Financial IPO: Price band set at Rs 700-740 per share, 40% discount to grey market valuation
HDB Financial Services likely to launch Rs 12,500-cr IPO by June-end; valuation pegged at around Rs 62k cr
HDB Financial Services likely to launch Rs 12,500-crore IPO by mid July
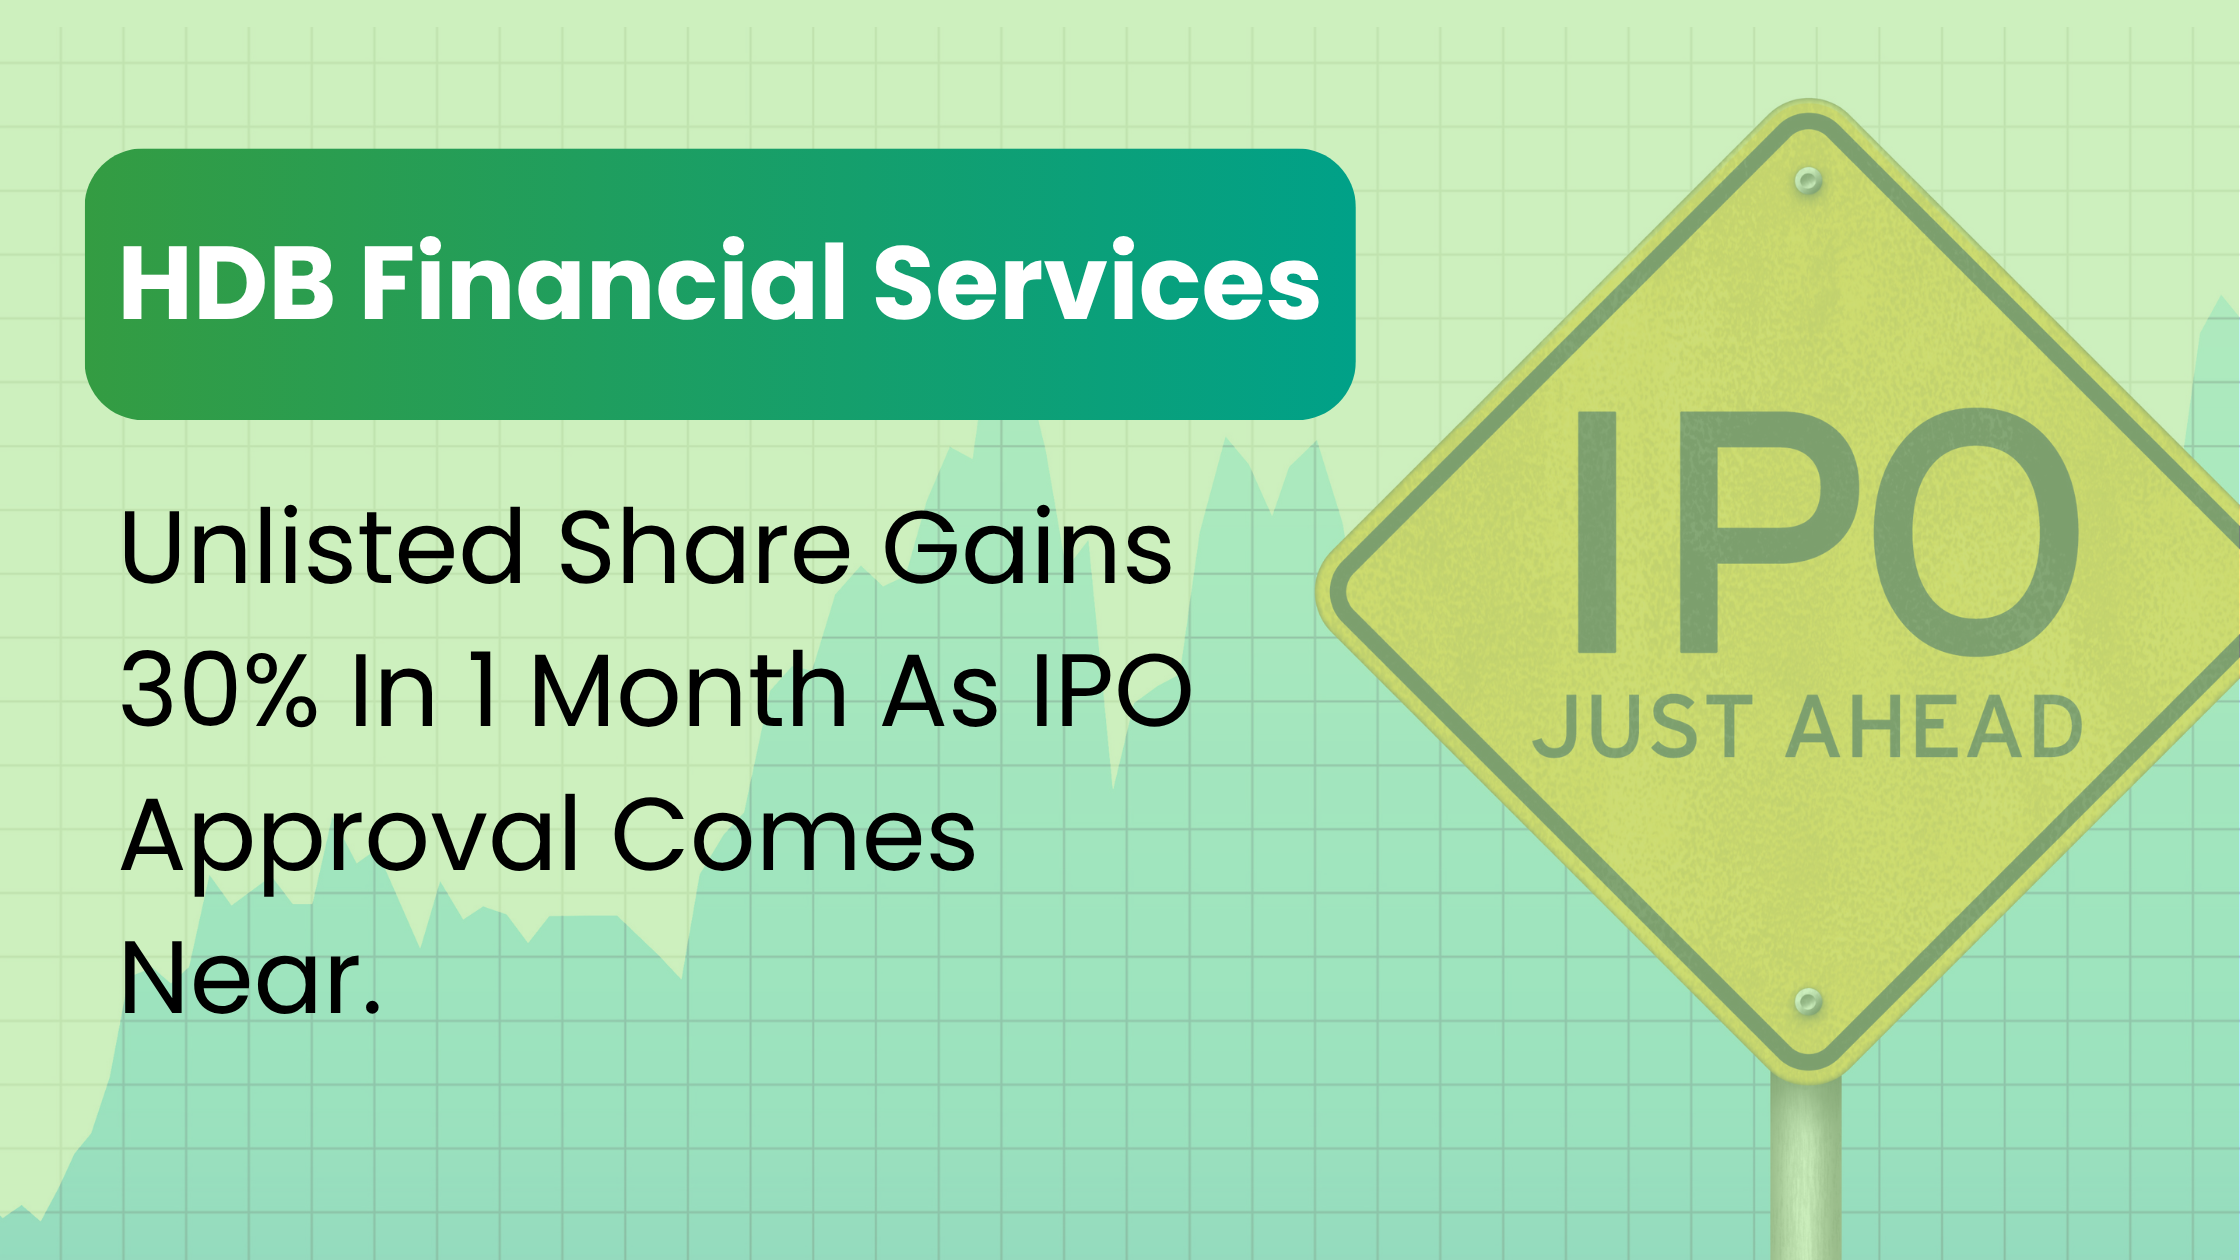
HDB Financial Services unlisted shares gain 30% in one month ahead of SEBI nod for IPO

SEBI set to clear IPOs of HDB Financial, Hero FinCorp, and Vikram Solar

Upcoming IPO of HDB Financial Services: HDFC Bank Can Finally See Value Unlocking

HDFC Bank gears up to list NBFC arm HDB Financial
Latest Article From The Experts
Top Unlisted companies
About HDB Financial Services Limited Unlisted Shares
Established in 2008, HDB Financial Services (HDBFS) is a leading non-banking financial company catering to the growing needs of an inspiring India. The company serves both retail and commercial clients. It is a significant Non-deposit-taking Non-banking Financial Company (NBFC). This is a well-established company business with robust capitalisation. The company is accredited with
Frequently Asked Questions
How to buy unlisted shares of HDB Financial Services Ltd?
How to Sell unlisted shares of HDB Financial Services Ltd?
What is the lock-in period of HDB Financial Services Ltd unlisted shares?
What is the minimum ticket size for investment in HDB Financial Services Ltd unlisted shares?
Is it legal to buy unlisted shares of HDB Financial Services Ltd in India?
Is Short-term capital gain tax applicable on HDB Financial Services Ltd unlisted shares?
Is there any Long-term capital gain tax to be paid on HDB Financial Services Ltd unlisted shares?
Applicability of Taxes on HDB Financial Services Ltd unlisted shares once it is listed?
How to check the credit or transfers of HDB Financial Services Ltd unlisted shares?
What is the documentation requirement for dealing in unlisted shares?
What are expected returns on unlisted shares of HDB Financial Services Ltd shares?
What is the price of HDB Finance IPO?
Will HDFC Shareholders get HDB Shares?
Are HDB Financial Services worth investing in?
How to buy HDBFS unlisted shares?
How to sell HDBFS unlisted shares in India?
What is the current price of HDB Financial Services unlisted shares?
How to look for the unlisted share price of HDB Financial Services?
How much ROI can I expect from HDB Financial Services unlisted shares?
What is the lock-in period of HDB Financial Services unlisted shares?
Are buying unlisted shares of HDB Financial Services legal?
Is HDB Financial listed?

