SBI General Insurance Ltd Unlisted Shares
Industry: Financial | Sector: Insurance | Depository: NSDL, CDSL
₹ 5,179.00
Key Indicators
| Key Indicators | 2025 |
|---|---|
| Current Share Price | 5,179.00 |
| Face Value | Share | 10.00 |
| Book Value | Share | 202.10 |
| Price To Earning (PE) | 87.80 |
| Price | Sales | 59.60 |
| Price | Book | 9.90 |
| Outstanding Shares (Crores) | 22.38 |
| Market Cap (Rs. Crores) | 44,648.10 |
| Debt | Equity | 4.40 |
| Dividend | Share | 0.00 |
| Dividend % (On Current Market Price) | 0.0% |
| Return on Total Assets | 2.1% |
| Return on Equity | 11.2% |
| Return on Working Capital | 2.9% |
* Ratio is calculated based on latest financial & current share price.
About The Company
SBI General Insurance Company Limited (SGICL), as per a credit rating report, is a joint venture between SBI and Insurance Australia Group Ltd. The company offers a complete suite of products ranging from motor, health, personal accident, travel, and home insurance in the retail space, and products such as aviation, fire, marine, package, construction, engineering, and liability insurance in the commercial space. The company was incorporated in 2009 and has its registered office located in Mumbai, Maharashtra.
Pricing Trend
Financial Summary
Revenue Growth %
EBITDA Margin %
NET Margin %
Profit & Loss Summary
(All Amount in ₹ Crores)
| PROFIT & LOSS | 2025 | 2024 | 2023 | 2022 | 2021 | 2020 | 2019 | 2018 |
|---|---|---|---|---|---|---|---|---|
| Revenue | 748.6 | 333.5 | 354.5 | 208.6 | 724.1 | 591.3 | 486.9 | 487.8 |
| Expense | 72.7 | 14.6 | 110.2 | 30.6 | 6.2 | 26.9 | 17.1 | 65.4 |
| EBITDA | 675.9 | 318.9 | 244.3 | 178.0 | 717.9 | 564.4 | 469.8 | 422.4 |
| Other Cost | 0.0 | 0.0 | 0.0 | 0.0 | 0.0 | 0.0 | 0.0 | 0.0 |
| Profit Before Taxes | 675.9 | 318.9 | 244.3 | 178.0 | 717.9 | 564.4 | 469.8 | 422.4 |
| Tax Expense | 167.2 | 79.1 | 60.1 | 46.8 | 174.3 | 152.6 | 135.8 | 26.7 |
| Profit after Taxes | 508.8 | 239.8 | 184.2 | 131.2 | 543.6 | 411.8 | 334.0 | 395.7 |
| Other Income | Exp. | 0.0 | 0.0 | 0.0 | 0.0 | 0.0 | 0.0 | 0.0 | 0.0 |
| Income (Net Of Taxes) | 508.8 | 239.8 | 184.2 | 131.2 | 543.6 | 411.8 | 334.0 | 395.7 |
| Outstanding Share | 22.4 | 22.3 | 21.6 | 21.6 | 21.6 | 21.6 | 21.6 | 21.6 |
| Earning per Share (Rs | Share) | 22.73 | 10.8 | 8.5 | 6.1 | 25.2 | 19.1 | 15.5 | 18.3 |
| Revenue Growth % | - | -55.5% | 6.3% | -41.2% | 247.1% | -18.3% | -17.7% | 0.2% |
| EBITDA Margin % | 90.3% | 95.6% | 68.9% | 85.3% | 99.1% | 95.5% | 96.5% | 86.6% |
| Net Margin % | 68% | 71.9% | 52% | 62.9% | 75.1% | 69.6% | 68.6% | 81.1% |
| Earning per Share Growth % | - | -52.5% | -21.3% | -28.2% | 313.1% | -24.2% | -18.8% | 18.1% |
Balance Sheet
(All Amount in ₹ Crores)
| Balance Sheet | 2025 | 2024 | 2023 | 2022 | 2021 | 2020 | 2019 | 2018 |
|---|---|---|---|---|---|---|---|---|
| Cash & Cash Equivalent | 342.3 | 170.0 | 135.2 | 157.6 | 430.8 | 212.1 | 183.1 | 39.0 |
| Non Current Asset | 21,875.2 | 18,230.0 | 13,373.5 | 11,161.2 | 9,808.3 | 7,555.2 | 6,489.8 | 5,438.8 |
| Current Asset | 2,184.9 | 1,447.5 | 1,771.2 | 1,402.2 | 1,142.0 | 1,527.4 | 701.5 | 501.5 |
| Total Asset | 24,402.4 | 19,847.5 | 15,279.9 | 12,720.9 | 11,381.2 | 9,294.8 | 7,374.4 | 5,979.3 |
| Equity Share Capital | 223.8 | 223.4 | 215.7 | 215.6 | 215.5 | 215.5 | 215.5 | 215.5 |
| Reserves | 4,300.3 | 4,236.4 | 2,857.5 | 2,757.1 | 2,600.1 | 1,915.3 | 1,605.0 | 1,325.1 |
| Total Equity | 4,524.0 | 4,459.8 | 3,073.1 | 2,972.7 | 2,815.6 | 2,130.8 | 1,820.5 | 1,540.6 |
| Non Current Liability | 700.0 | 700.0 | 0.0 | 0.0 | 0.0 | 0.0 | 0.0 | 0.0 |
| Current Liability | 19,178.4 | 14,687.7 | 12,206.8 | 9,748.2 | 8,565.6 | 7,164.0 | 5,553.9 | 4,438.7 |
| Total Liabilities | 19,878.4 | 15,387.7 | 12,206.8 | 9,748.2 | 8,565.6 | 7,164.0 | 5,553.9 | 4,438.7 |
| Total Equity & Liability | 24,402.4 | 19,847.5 | 15,279.9 | 12,720.9 | 11,381.2 | 9,294.8 | 7,374.4 | 5,979.3 |
Cash Flow Summary
(All Amount in ₹ Crores)
| CASH FLOW SUMMARY | 2025 | 2024 | 2023 | 2022 | 2021 | 2020 | 2019 | 2018 |
|---|---|---|---|---|---|---|---|---|
| Operating Activity | 2,835.8 | 2,004.8 | 1,498.1 | 356.8 | 1,729.5 | 771.5 | 953.1 | 568.2 |
| Investing Activity | -3,171.1 | -3,156.0 | -1,360.8 | -992.1 | -1,140.6 | -649.6 | -883.3 | -381.3 |
| Financing Activity | -37.2 | 1,538.5 | 1.7 | 6.5 | -21.6 | -21.6 | -4.4 | 0.0 |
| Net Cash Flow | -372.5 | 387.3 | 139.0 | -628.8 | 567.3 | 100.4 | 65.3 | 186.9 |
Share Holding
Registered Address
ISIN: INE01MM01017
PAN: AAMCS8857L
9th Floor, A & B Wing Fulcrum Building,Mumbai-400099
Management
Dinesh Kumar Khara
chairman
Kishore Kumar Poludasu
managing director & ceo
Rikhil K Shah
chief financial officer
Shatrughan Singh
company secretary
Download Financial Result
News

SBI General Insurance appoints Jaya Tripathi as head of key relations

SBI General PBT jumps 11.3% to Rs 470 crore in FY19

SBI General Insurance Half Year Net Profit Soars To Rs 414 Cr

SBI General Insurance Certified as Great Place To Work

SBI General Insurance Appoints Mr. Rakesh Kaul as Chief Business Officer

SBI General Insurance appoints Jaya Tripathi as head of key relations

SBI General Insurance launches insurance buying facility via whatsapp

SBI General launches purely digital health cover
Latest Article From The Experts
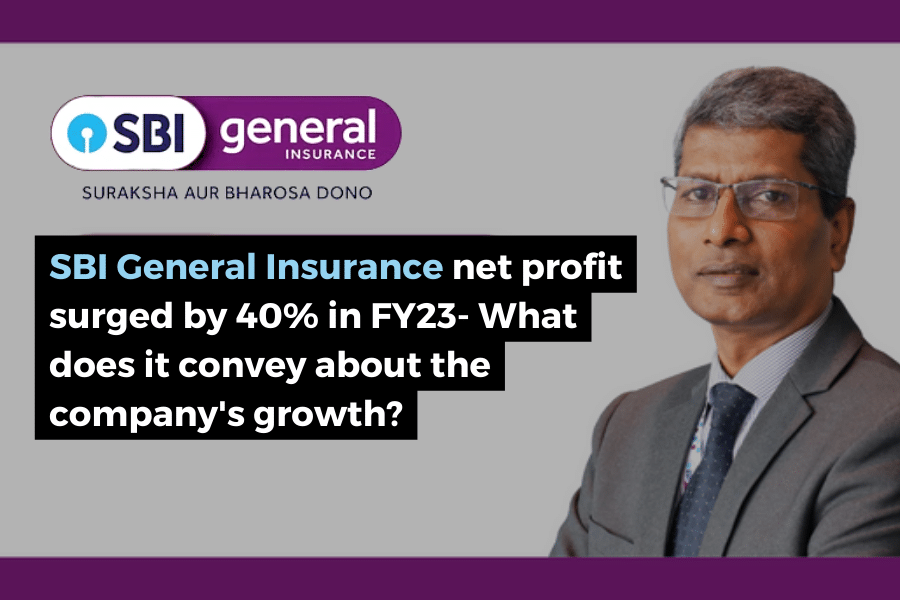
SBI General Insurance's Net Profit Surged By 40% In FY23- What Does It Convey About The Company's Growth?
What Could Be The Benefits Of SBI's Partnership With Bajaj Finance?
Outlook For SBI General Insurance 2023: A Promising And Transformative Year
SBI General Insurance FY23 Net Profit Surged By 40%; How Will It Impact Unlisted Stock Prices?
Top Unlisted companies
About SBI General Insurance Ltd Unlisted Shares
Established in 2009, SBI General Insurance Company Limited is headquartered in Mumbai, India, offering a diverse range of general insurance products since its inception. The insurance includes home, automobile, personal accident, energy, marine, travel, and casualty insurance. Its insurance products and services are also available in rural areas, including crop and cattle insurance. With its robust foundation of trust and security, the company...
Frequently Asked Questions
How to buy unlisted shares of SBI General Insurance?
How to Sell unlisted shares of SBI General Insurance?
What is the lock-in period of SBI General Insurance unlisted shares?
What is the minimum ticket size for investment in SBI General Insurance unlisted shares?
Is it legal to buy unlisted shares of SBI General Insurance in India?
Is Short-term capital gain tax applicable on SBI General Insurance unlisted shares?
Is there any Long-term capital gain tax to be paid on SBI General Insurance unlisted shares?
Applicability of Taxes on SBI General Insurance unlisted shares once it is listed?
How to check the credit or transfers of SBI General Insurance unlisted shares?
What is the documentation requirement for dealing in unlisted shares?
What are expected returns on unlisted shares of SBI General Insurance shares?
At what price SBI General Insurance unlisted shares are available?
How much profit did State Bank Of India General Insurance earn in FY23?
How do I buy SBI General Insurance pre-IPO shares?
Where do I check the unlisted share price of State Bank Of India General Insurance daily?
Is there any risk of buying SBI General Insurance unlisted shares?


